


SKU/Artículo: AMZ-B08F3PBLCL
Texas Instruments
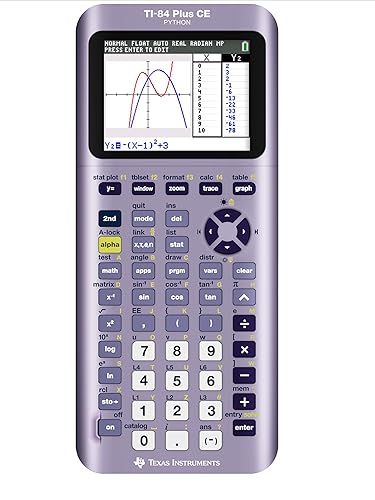
Texas Instruments TI-84 Plus CE-T Python Edition Graphical Calculator (Colour Display) Black
Style:
Single
Detalles del producto
Disponibilidad:
En stock
En stock
Peso con empaque:
0.41 kg
0.41 kg
Devolución:
No
No
Condición
Nuevo
Nuevo
Producto de:
Amazon
Amazon
Viaja desde
USA
USA
Sobre este producto
- TI-84 Pus CE-T Python Edition Numerical evaluations in table format for all graphic modes. Interactive analysis of functional values, roots, maxima, minima, integrals and derivatives 8 different graph formats for individual representations of all graphs. Optional horizontal and vertical screen layout Display graph and table side by side. Stores up to 10 matrices Available matrix operations: Reverse, Determinant, Transpose, Matrix Extension, Stair Normal Shape, and Elementary Line Transformations. Convert matrix to list (and vice versa) List-based statistical analysis for one or two variables, including logistics, sine, median-median, linear, logarithm, exponential, potency, square, cubic and quaternal regression models 3 definitions of statistical diagrams for scatter charts, line charts, histograms, boxplots and modified boxplots as well as normal distribution charts. Higher statistics functions, including 10 statistical test functions, 7 confidence interval functions and one-way analysis of variance. 15 probability distribution functions such as normal, student-t, chi-square, binomial and poisson Financial mathematical functions such as time value of money, cash flows and amortization. Interactive full-screen editor to solve time value problems Interactive equation editor for numerical resolution according to different variables in one equation 11 regression calculations. Programming in Python USB port for connecting a computer
S/ 1,123.67
60% OFF
S/ 449.47
IMPORT EASILY
By purchasing this product you can deduct VAT with your RUT number
S/ 1,123.67
60% OFF
S/ 449.47
con envío
Conoce más detalles
The TI-84 Plus CE-T Python Edition Graphing Calculator is extremely light and handy. This new model allows programming in Python. With 3 MB flash ROM memory for data archiving and storage of apps Calculator with ideal readability thanks to high-resolution, backlit display. Screen size: 320 x 240 pixels (2.8" diagonal) in 140 DPI resolution, colour depth 16 bit. Built-in TI battery (the TI battery can last up to a week after charging.) Add images as chart background, change function graphs in 15 colors, format and color of graph axes and grids. 3 definitions of statistical diagrams for scatter charts, line charts, histograms, boxplots and modified boxplots as well as normal distribution charts Available matrix operations: Reverse, Determinant, Transpose, Matrix Extension, Stair Normal Shape, and Elementary Line Transformations. Convert matrix to list (and vice versa) List-based statistical analysis for one or two variables, including logistics, sine, median-median, linear, logarithm, exponential, potency, square, cubic and quaternal regression models Add custom apps to your TI-84 Plus CE-T Python Edition. This allows you to extend the functionality of your computer. These specific math and science functions deepen your understanding
Compra protegida
Disfruta de una experiencia de compra segura y confiable
![]() Garantía de entrega
Garantía de entrega
Con Tiendamia todas tus compras cuentan con Garantía de Entrega o devolución total de tu dinero.
Compras 100% seguras y garantizadas, para que pidas lo que sueñas y lo recibas del mundo a tu puerta.
Saber más.Visa
Mastercard
American Express